The BCG (Boston Consultancy Group) Growth Share Matrix classifies product lines into four categories based on their market share and market share growth rates. The BCG growth share matrix helps firms decide how much money to invest in a product line, based on whether a product has a good market share and whether the market share is increasing, decreasing or remaining constant.
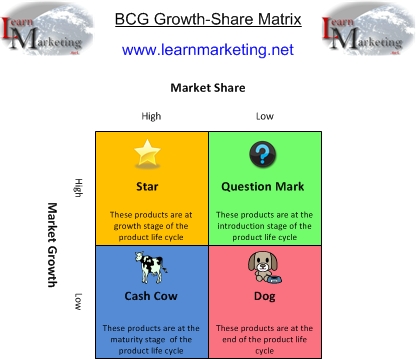
The diagram below shows how the BCG Growth Share Matrix divides products into four groups depending on their market share and market group.
BCG Growth Share Matrix Star
A product classified as a star by the BCG Growth Share Matrix has a high market share in a market that is growing. A star is at the growth stage of the product life cycle so it will need investment (money) to maintain its growth rate and market leading position.
As it is generating money for the company, it is worth the investing in. The challenge for the business is to turn it into a cash cow once growth begins to decline.
Towards the end of the Cash Cow stage, product sales will decline, so it is prudent to review marketing mix strategies to maintain high sales for as long as possible. The firm could also look at reducing costs through price leadership strategies.
BCG Growth Share Matrix Cash Cow
Cash Cows are products at the mature stage of the product life cycle, they generate high amounts of cash for the company, but their growth rate is slowing down. As market growth rate is slowing, investment should be reduced to the amount needed to maintain current market share. A cash cow is at the maturity stage of the product life cycle but it generates a lot of profit because research and development costs should have been recouped by this stage.
Towards the end of the Cash Cow stage product sales will decline, so it is prudent to review marketing mix strategies to maintain high sales for as long as possible.
The firm could also look at reducing costs through price leadership strategies.
Example:Apple’s iPhone can be considered a cash cow. Although the smartphone market is maturing and growth has slowed, the iPhone still generates enormous profits due to its high market share and brand loyalty. Apple focuses on maintaining this position through incremental updates and ecosystem integration.
BCG Growth Share Matrix Dogs
Products categorised as dogs by the BCG Growth Share Matrix have a low market share and are in a market with a low growth rate. A dog product generates low profits and sometimes a loss. Dog products will drain money, time and other resources. A dog product is at the end of the product life cycle so it needs to be removed or redeveloped unless it is providing the business with another benefit such as being a "gateway" to other products.
Example: Microsoft's Zune music player is an example of a dog. It failed to gain significant market share in a declining MP3 player market dominated by Apple's iPod. Microsoft eventually discontinued the Zune line, shifting focus to other areas.
BCG Growth Share Matrix Question Mark (Problem Child)
As the name suggests a product classified as a question mark by the growth share matrix presents the company with a question; the question of what to do. This is because a "question mark" product is generating low sales but it is part of a market that has high growth. The challenge for the firm is to find out why sales are low and why the firm's market share is not growing. If the firm solves the problem of low sales it could turn the "question mark" product into a star but if they don't further investment in the product will be a waste of money and resources.
Example: The Meta Quest VR headsets are an example of a question mark. While the virtual reality market is growing, Meta's headsets face competition from other brands like Sony and HTC. Meta is investing heavily to increase market share, hoping to turn this product into a star.
Conclusion
The BCG Growth Share Matrix is a good starting point when reviewing an existing product line to decide future strategy and budgets. The market share is compared (relative to) against the largest competitor in the industry. The BCG Growth Share Matrix helps firms analyse future opportunities or problems with their product lines so that they can streamline and grow product ranges effectively.
Studying Business Management visit www.learnmanagement2.com